Finance
2.4 Contribution & break-even analysis
Contribution
- The giving or supplying as a part or share of the total.
- Contribution per unit = Price – Average Variable Cost
Profit formula
- Profit = Quantity x Price - (Fixed Costs + (Average Variable Cost x Quantity))
Break-even analysis
- It is where profit = 0, meaning the revenue covers the costs.
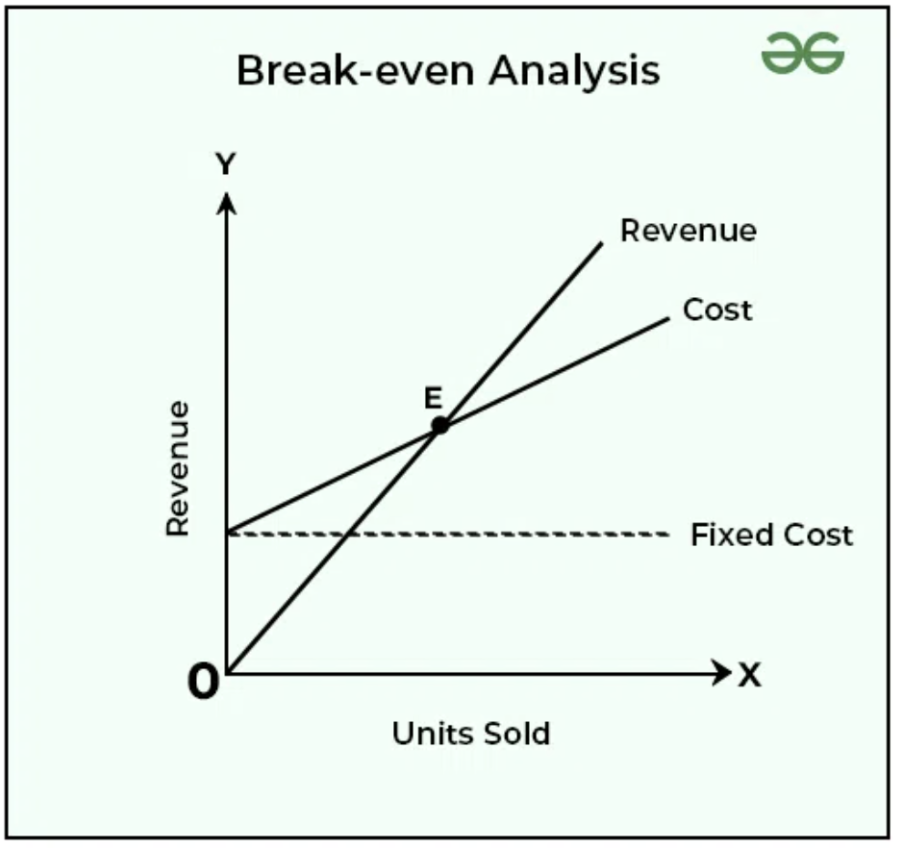
- Step by step to calculate and graph the break-even chart:
- Write profit equation = 0 ; 0 = Quantity x Price - (Fixed Costs + (Average Variable Cost x Quantity))
- Rearrange equation to find the unknown Quantity (the values will be given in question).
- After quantity value is found, calculate Quantity x Price to find the revenue.
- Plot a graph with Quantity in the x-axis and Revenue in the y-axis.
- Mark the break-even point (point with the Quantity and Revenue values that you calculated in step 2 and 3).
- Draw a line from 0,0 that passes through the break-even point and continue it until the end of the graph's axes.
- Draw the fixed cost curve (straight horizontal line with the value of fixed cost given in question).
- Draw total cost line starting at the fixed cost line and passing through the break-even point, and continue it until the end of the chart's axes.
- Write a title for the chart; e.g. break-even analysis for ____ at date ______.
- Remember to label the axes of the graph.
- Remember to label each line of the graph and the break-even point.
- it should look like this:
Margin of safety
- The difference between current/forecasted sales and the quantity of sales at breakeven point.
- output – breakeven point quantity.

Author: Felipe Rodrigues
Contact: fr1@stpauls.br


